Application Usage
1. Login to Radsmart Receiver
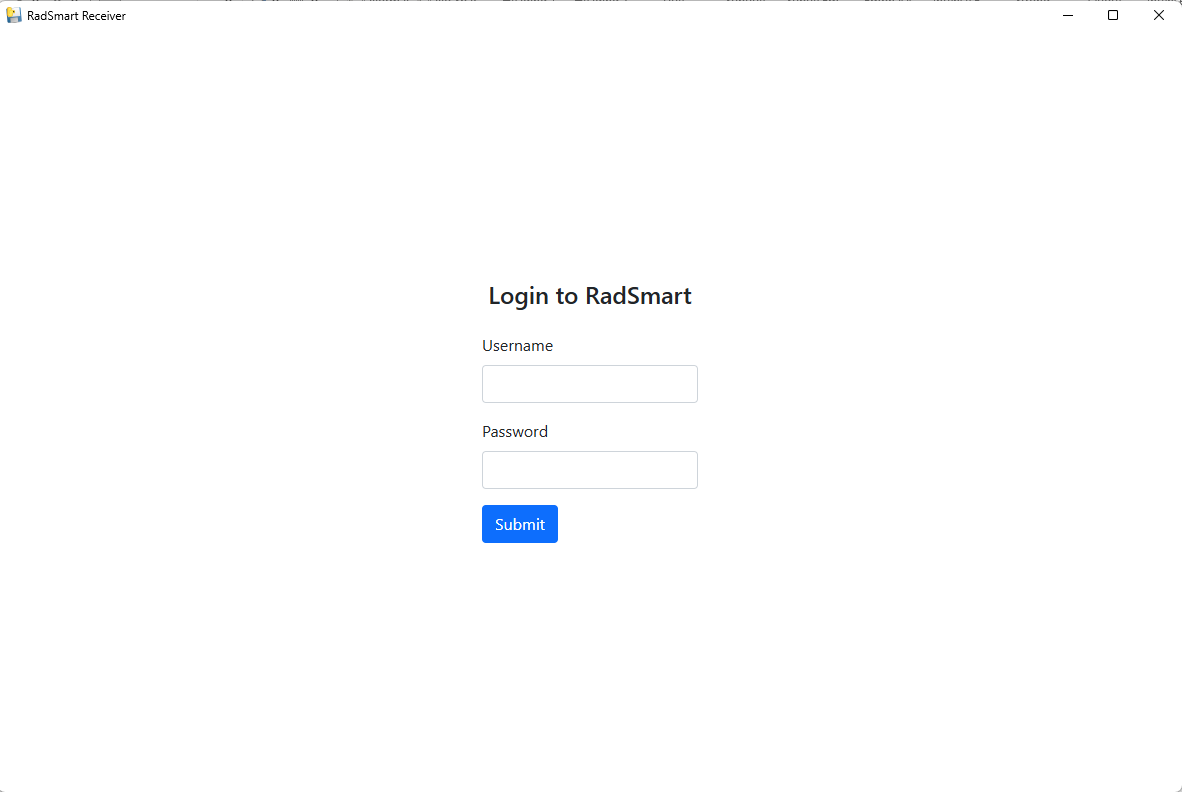
After installation completes, the application will launch (or open it manually). You will see the login screen.
Enter your credentials:
- Username
- Password
Click Submit to access the system.
2. Access Radsmart Dashboard
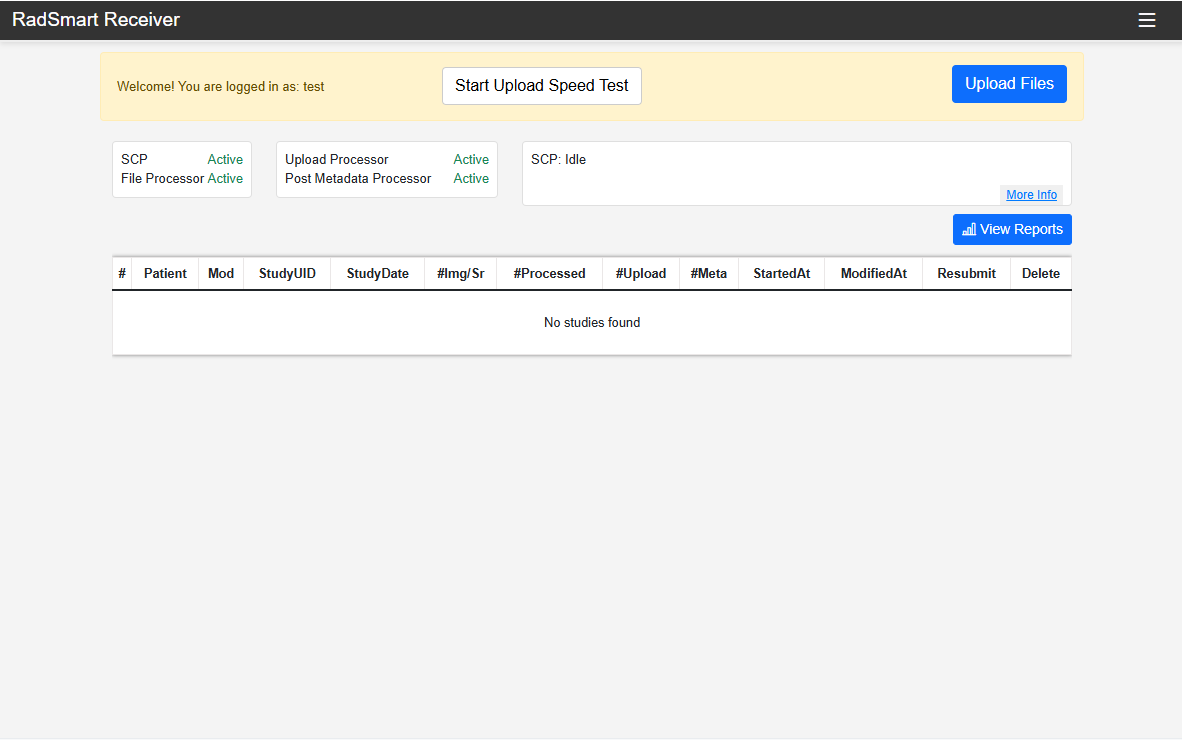
After successful login, the main dashboard will appear. You will see:
- System status (SCP, Upload Processor, Metadata Processor)
- Upload controls
- Study/activity table
Key actions available:
- Click Upload Files to begin uploading data
- Click Start Upload Speed Test to verify connection performance
- Use View Reports to monitor activity
3. Access System Menu and Configuration Options
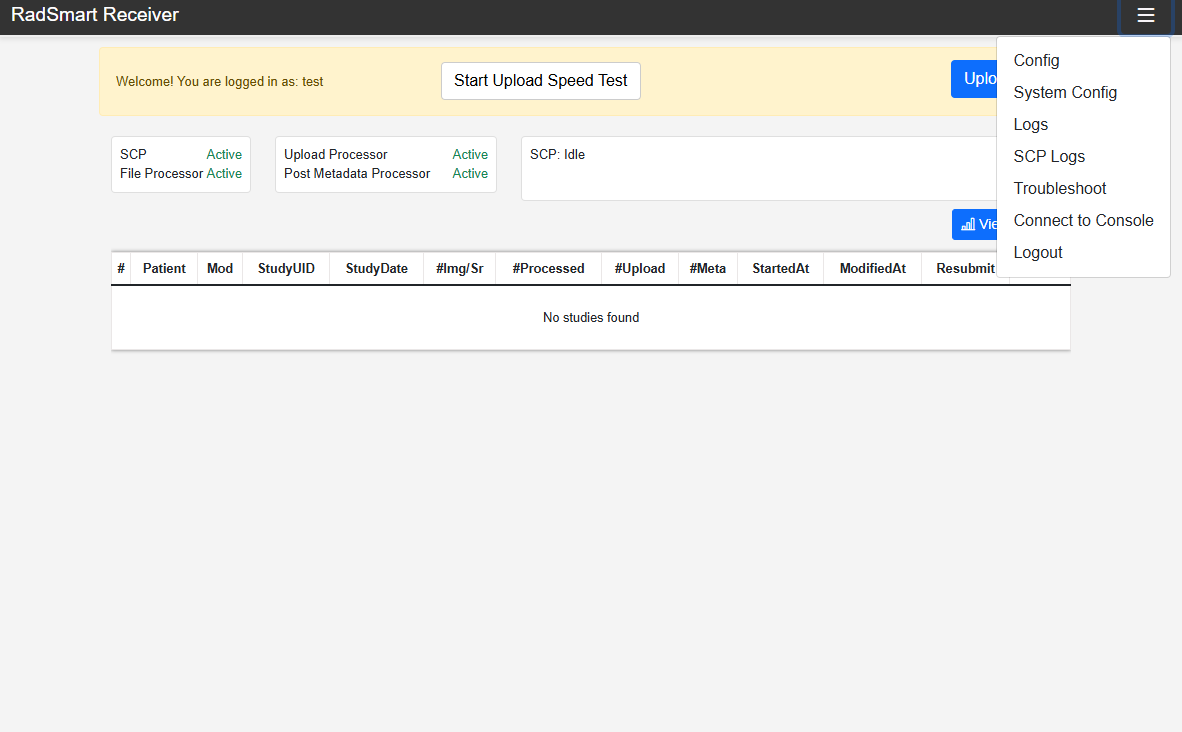
On the dashboard, click the menu icon (☰) in the top-right corner. A dropdown menu will appear with the following options:
- Config — Basic application configuration
- System Config — Advanced/system-level settings
- Logs — General application logs
- SCP Logs — File transfer logs
- Troubleshoot — Diagnostic tools
- Connect to Console — Access system console
- Logout — Exit the application
Select Upload Type
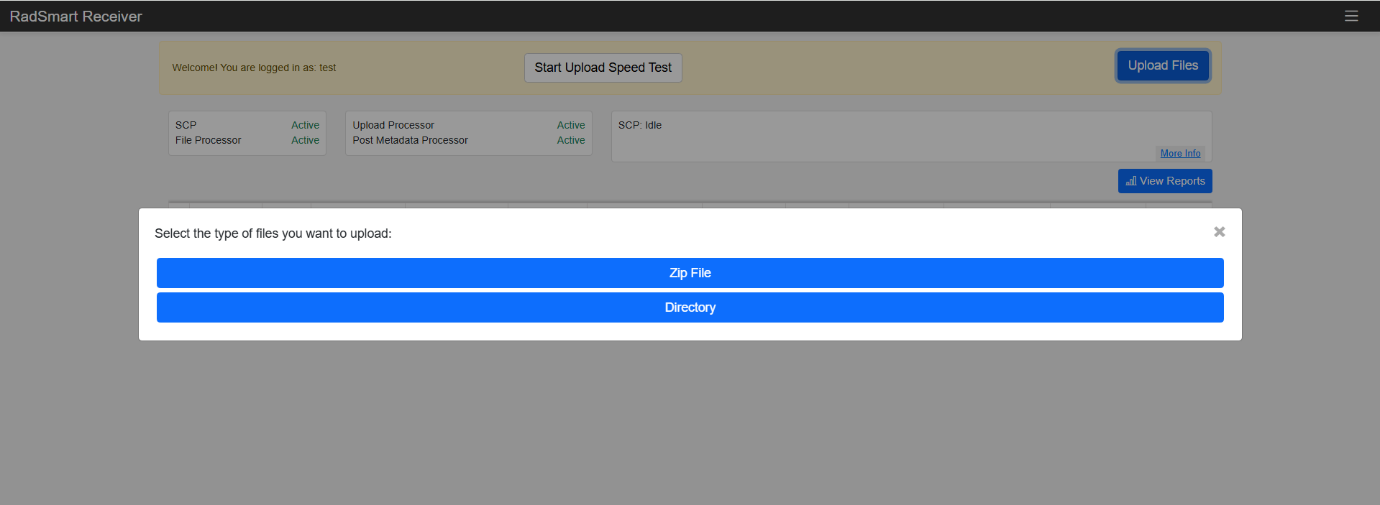
You will be presented with two options:
- Zip File — Upload compressed files; recommended for batch uploads
- Directory — Upload an entire folder; useful for structured datasets (e.g., DICOM folders)
4. Authentication for Configuration Access
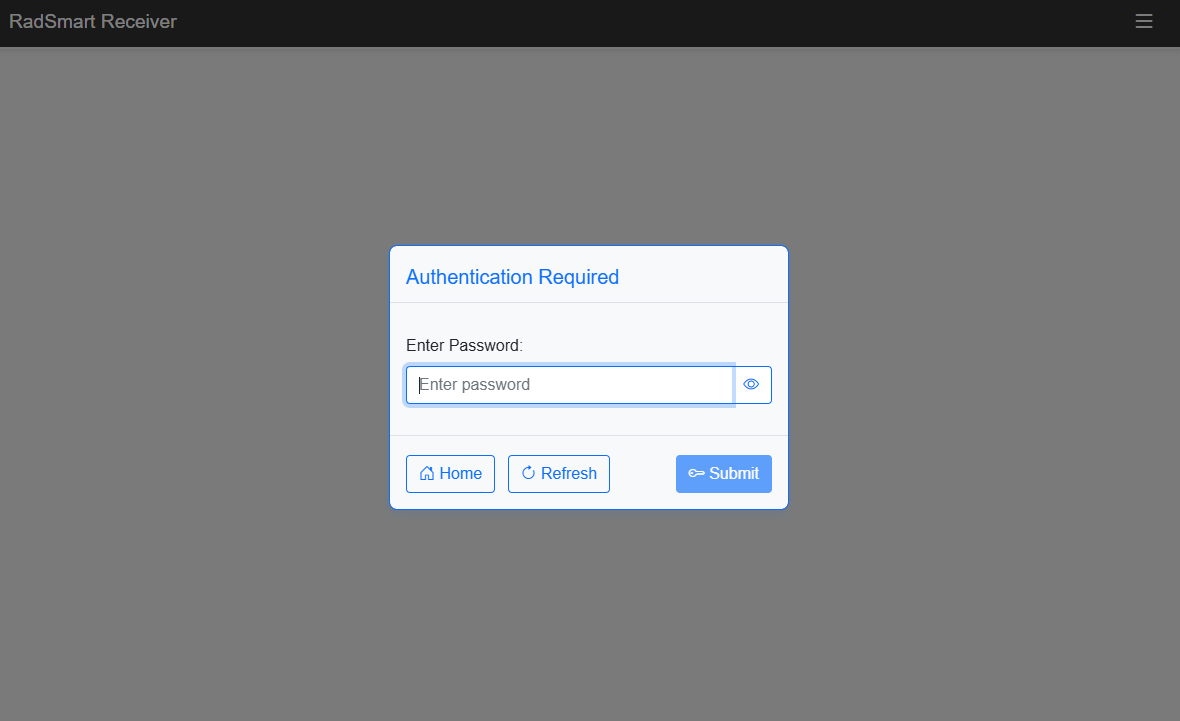
When you click Config or certain restricted options, an authentication prompt appears. This is a security verification step.
Action:
- Enter the required password
- Click Submit to proceed
Other options:
- Home — Return to dashboard
- Refresh — Reload the prompt
4.1. Configure Environment Settings
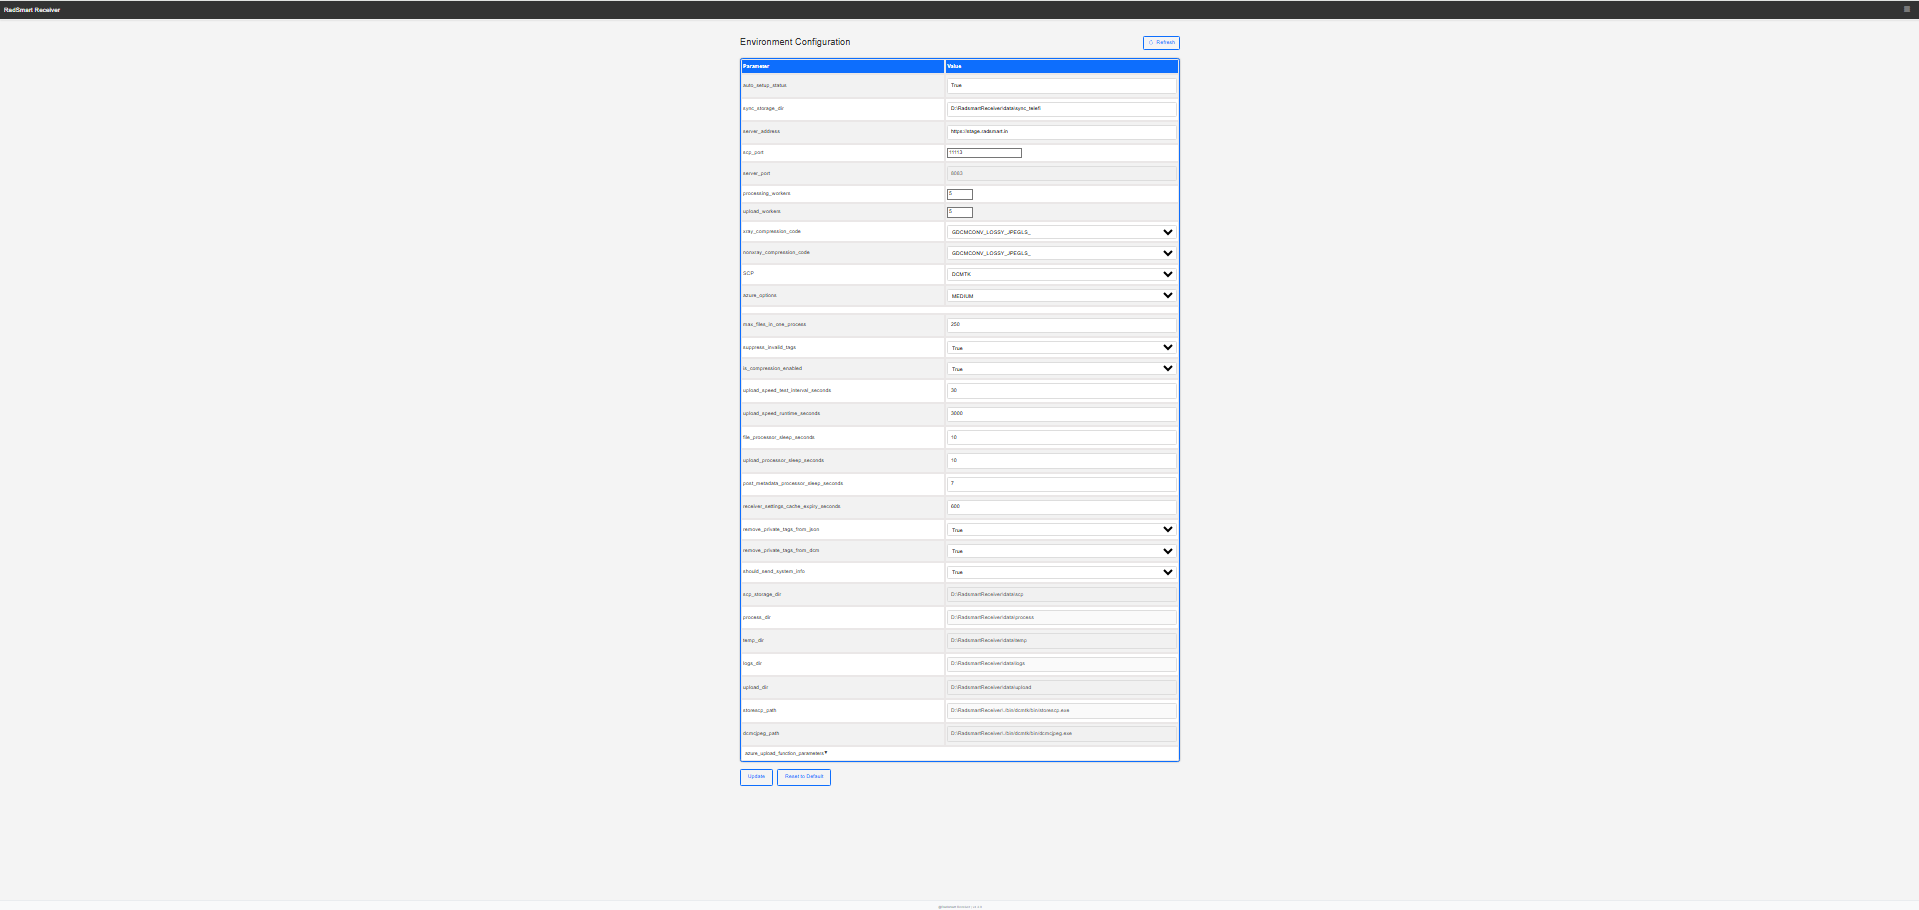
After successful authentication, the Environment Configuration screen will be displayed. This panel allows you to view and modify system parameters.
Available actions:
- Edit configuration values in the Value column
- Adjust system behavior such as:
- Storage paths
- Processing parameters
- Compression settings
- Timeout values
- Use the buttons at the bottom:
- Update — Save changes
- Reset to Default — Restore default configuration
5. View System Information
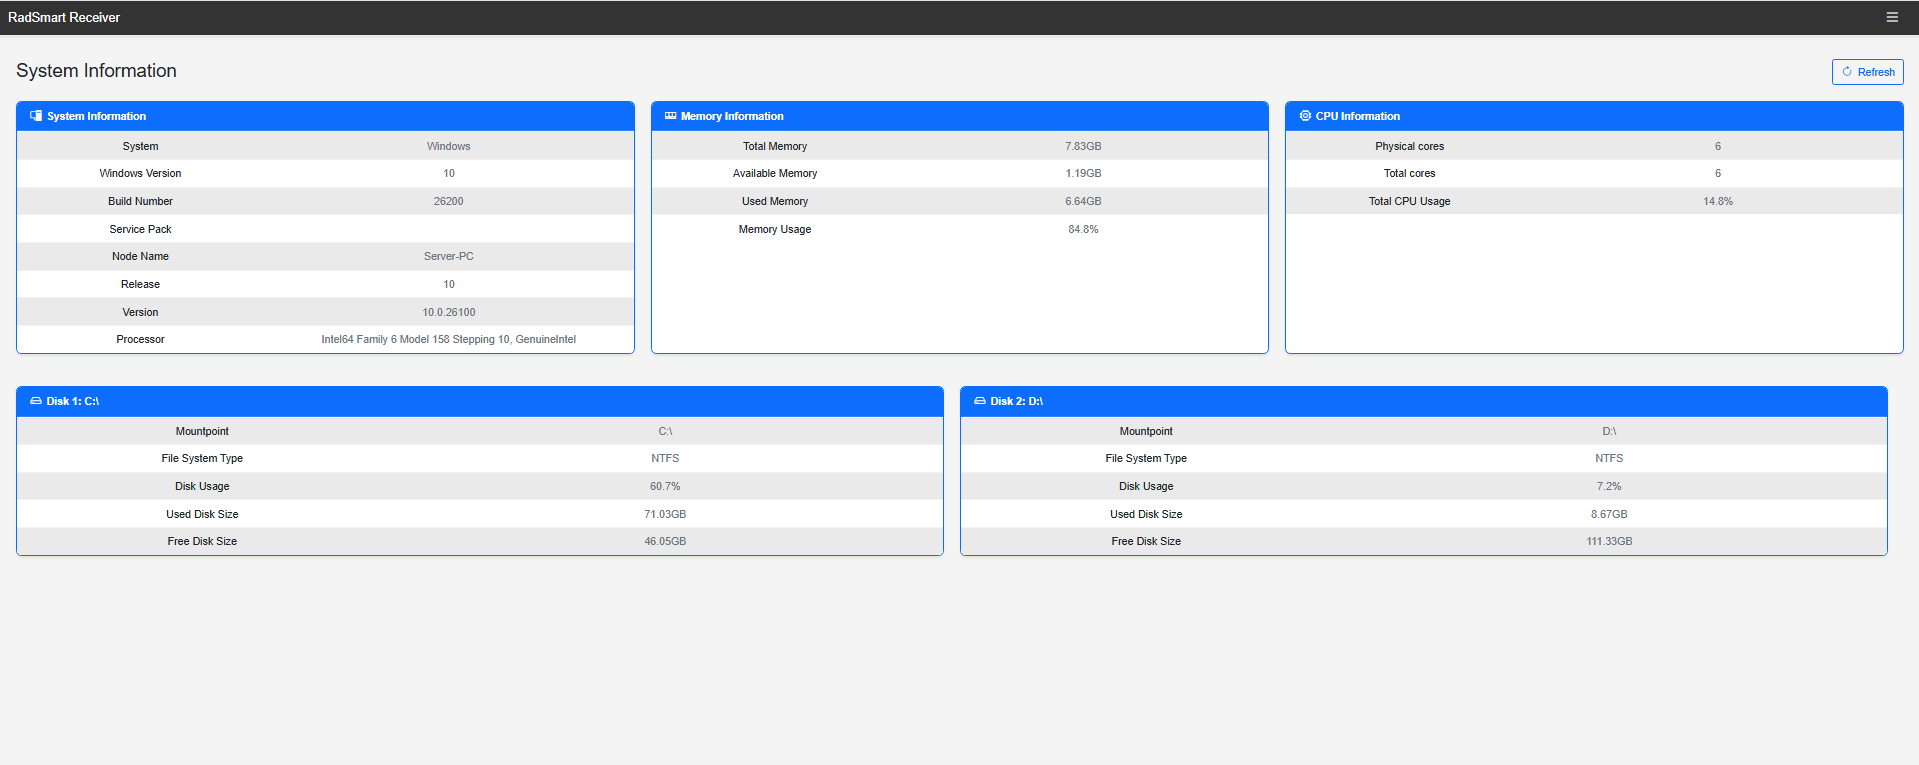
Navigate to System Config (or the relevant option from the menu). The System Information dashboard will be displayed.
Displayed information includes:
-
System Information
- Operating System (e.g., Windows 10)
- Build number and version
- Machine name
- Processor details
-
Memory Information
- Total memory
- Available memory
- Used memory
- Memory usage percentage
-
CPU Information
- Number of cores
- CPU usage percentage
-
Disk Information
- Disk partitions (e.g., C:, D:)
- File system type (NTFS)
- Disk usage
- Free and used space
6. View Process Logs
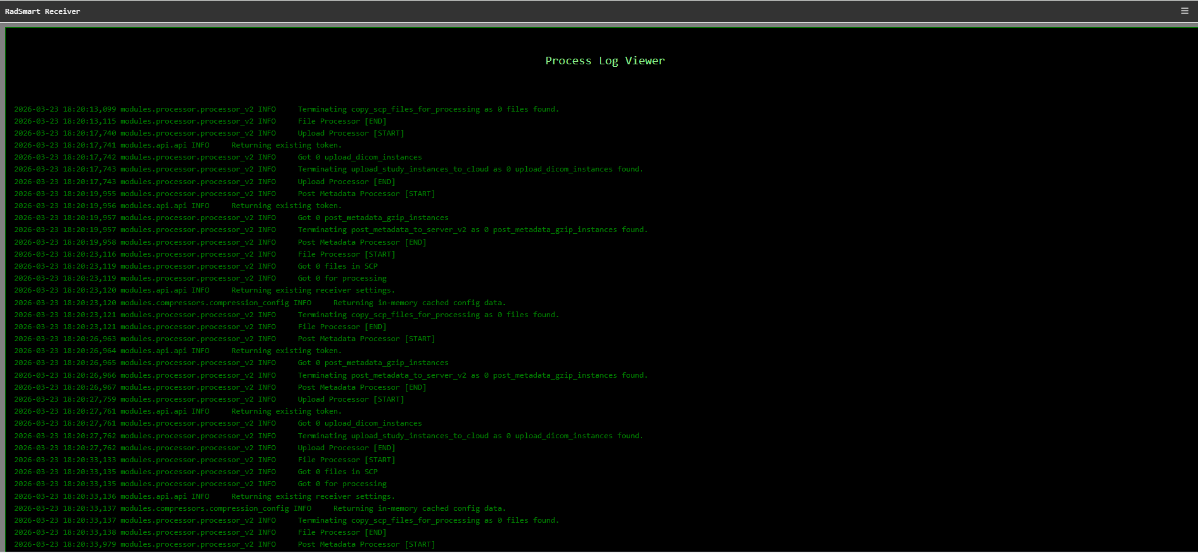
Navigate to Logs or SCP Logs from the menu. The Process Log Viewer screen will be displayed.
Example activities in logs:
- File Processor start/end
- Upload Processor execution
- Metadata processing status
- SCP file handling
Purpose of this step:
- Monitor system operations in real time
- Diagnose issues such as:
- Files not being processed
- Upload failures
- Service interruptions
How to use:
Look for:
- Errors or warnings
- Repeated failures
- No activity (indicates idle or issue)
7. Troubleshooting Dashboard
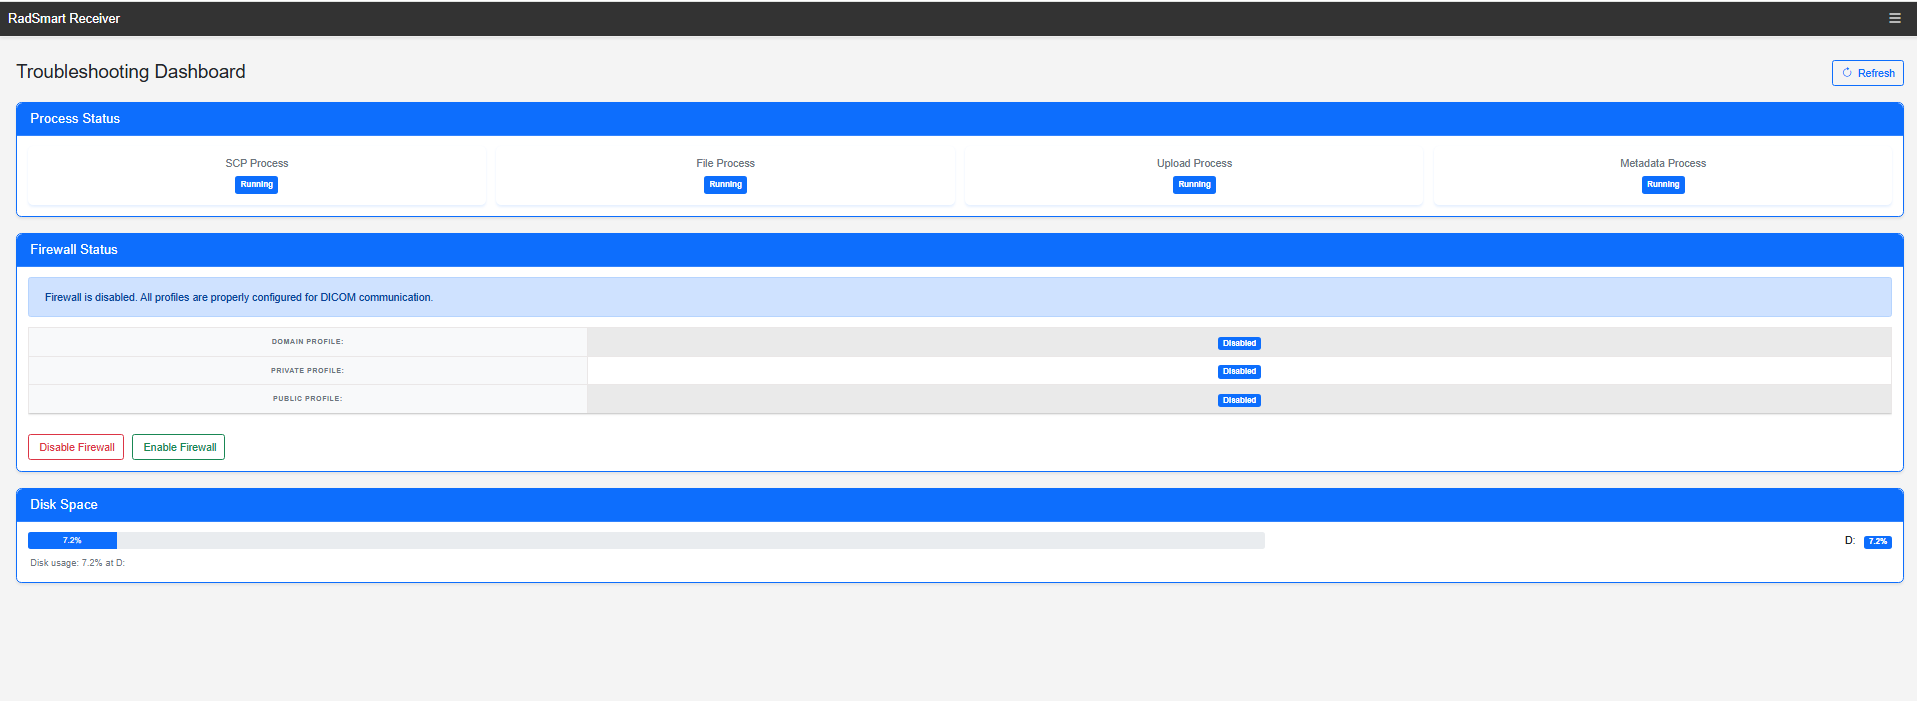
Navigate to Troubleshoot from the menu. The Troubleshooting Dashboard will be displayed.
When to use:
- If uploads are failing
- If services are not running
- If system performance is degraded
- During routine system checks
8. Configure Console Connectivity (DICOM Setup)
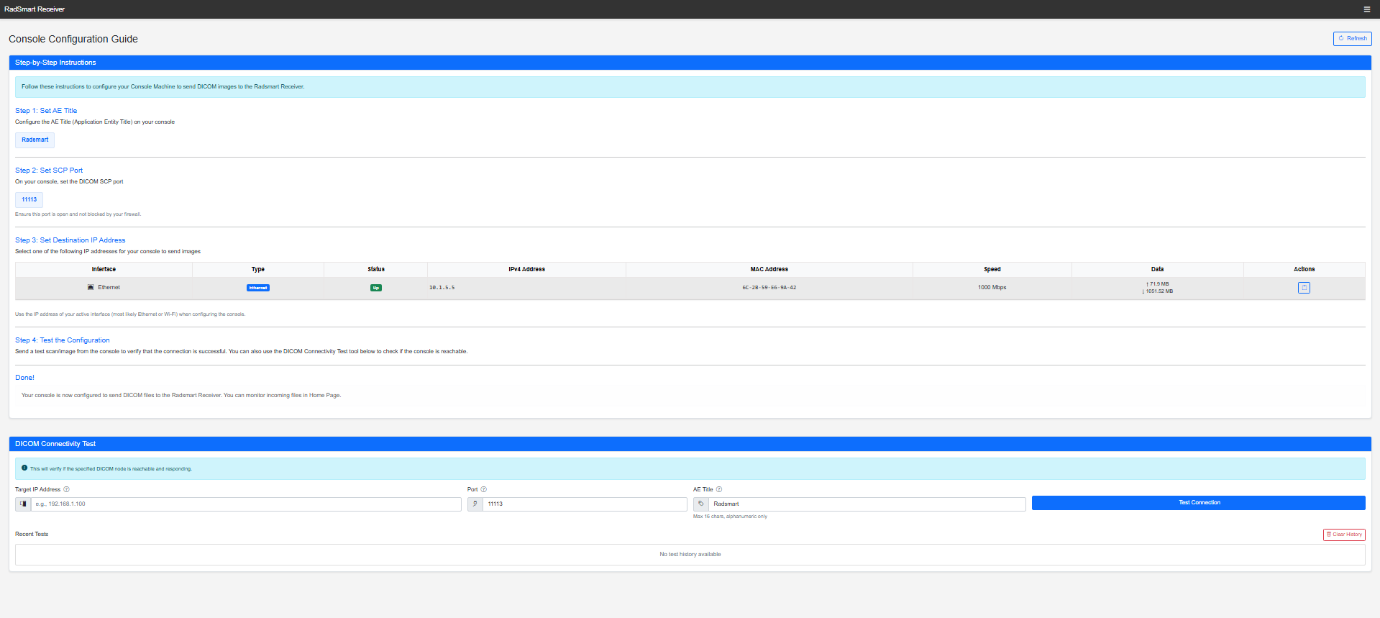
Navigate to Connect to Console from the menu. The Console Configuration Guide screen will be displayed.
Purpose of this step:
Enables external systems (e.g., imaging devices) to:
- Send DICOM images to Radsmart Receiver
- Establish network and protocol-level connectivity